Knowing the average performance makes it easier to compare how you are doing. The truth is averages and “industry benchmarks” don’t really matter. You need to have some comparison point, but global or industry averages shouldn’t be your comparison point because your situation is incredibly unique.
With physical expansion slowing, many leading retailers are taking a harder look at the performance metrics of their existing locations. Given the more intense focus on metrics, forward-thinking retailers are adopting sophisticated traffic counting systems and developing conversion rate analytics to precisely track how many shoppers are actually making purchases.
“Knowing your conversion rate lets retailers see how well they are doing, how much the shopper felt the promise of your brand at the door, delivered on the rack, and how much money you might be leaving on the table,” says Bob Phibbs of The Retail Doctor, a sales training consultancy specializing in the retail sector, who has worked with organizations such as True Value Hardware.
Given the economic slowdown and increased pressures to show top and bottom line growth, missing out on capturing customers while they are in a store is becoming an opportunity retailers can no longer afford to miss. Major retailers such as Virgin Megastores, Marks & Spencer, and Crabtree & Evelyn have served as a few of the early case studies for the benefits of measuring and improving conversion rates.
Virgin has credited the analysis with uncovering variations of up to 20% in average transaction values between stores, as well as a 15 point difference in conversion rates between its highest and lowest performing stores. Jason Toy, a division manager for Virgin Retail, said the analysis has been beneficial in highlighting store level performance, as well as regional customer profiles. “From the outset we linked the FootFall information to our store customer service program which has been extremely effective in creating a clear understanding of how service drives conversion,” he said.
Once retailers start collecting the performance analysis from individual stores, they are often surprised by the results. “If you were to ask a retailer how many shoppers they convert, the assumption is typically north of 50%,” said David Smyth, Vice President of sales operations for Experian FootFall. “In reality, the average conversion rate ranges between 20% and 40% for most retailers. Using that average, that means about 70% of shoppers are leaving the store without buying anything. That means retailers are leaving an awful lot of money on the table.”
With major retailers realizing that even a 1% improvement in conversion rates can equate to millions of dollars dropping to the bottom line, more and more are utilizing traffic counting analysis-- not only at the headquarters level, but also providing the analysis directly to store managers and other personnel. For example, Marks & Spencer has used its visitor count system to build staffing plans that better match the customer to each department within a store. “By making small, simple, sustainable changes in staffing, product availability and service based on our findings, Marks & Spencer has been able to drive measurable improvements in conversion, units per transaction and basket size,” said Bill Donald, a manager with Marks & Spencer.
Tracking Ad Impact
In addition to highlighting operational opportunities for staffing and merchandise adjustments, industry analysts point out that traffic counting and conversion rates also help to measure the effectiveness of a retailer’s marketing efforts. “You can see if your advertising creates more traffic or more sales from the existing traffic,” says Mark Lilien, Consultant with Retail Technology Group, which has worked on strategic initiatives with clients including Circuit City, KB Toys, and Coach.
Laura Davis-Taylor, Founder and Principal with Retail Media Consulting, suggests that the bigger opportunity for retailers is learning more about the in-store behavior of shoppers. “Frankly, any retailer that is interested in shopper insights that unveil the desires and causal triggers for the human behaviors of the people in their aisles benefit from conversion rates,” Davis-Taylor says. “What we are doing is finally bringing the best practices of marketing into the store environment. It's interesting that it's taken so long, as those insights lead to the knowledge on what works and does not work to positively affect these valued people.”
She adds that in order to gain better insights into moving a shopper from an exposure to a purchase, retailers need to move from a “Find Me/Sell Me” approach to a “Know Me/Help Me” strategy that applies to “every touch” to customers. “We can't know and help people if we don't know what they want to make their shopping experience
better and deliver on this with relevant, welcomed communications. It's just that simple: give people what they want and we are much more likely to turn them into purchasers.”
better and deliver on this with relevant, welcomed communications. It's just that simple: give people what they want and we are much more likely to turn them into purchasers.”
Ecommerce conversion rates
Our compilation comparing average conversion rates for retail sites and other industry sectors
As you will know, conversion rate is often used as a KPI to review the effectiveness of Ecommerce sites. Naturally, all site managers and owners want to know, "how do our conversion rates compare?"
In this post, I have compiled different free industry sources focusing on retail Ecommerce conversion, but towards the end of the post, a chart shows average conversion rates for a range of sectors including B2B conversion. At the end of this article, we also feature an analysis of Unbounce landing page lead generation conversion by sector.
Before we get to the stats, one other caveat on analysis of conversion rates:
When benchmarking conversion rate, we think it's important to explain to marketing managers that they should go beyond headline conversion rates to segment conversion by different types of visitor.
To see why see Dan Barker's excellent post explaining why conversion rate is a horrible measure to focus on...
June 2018 update - Ecommerce conversion funnel
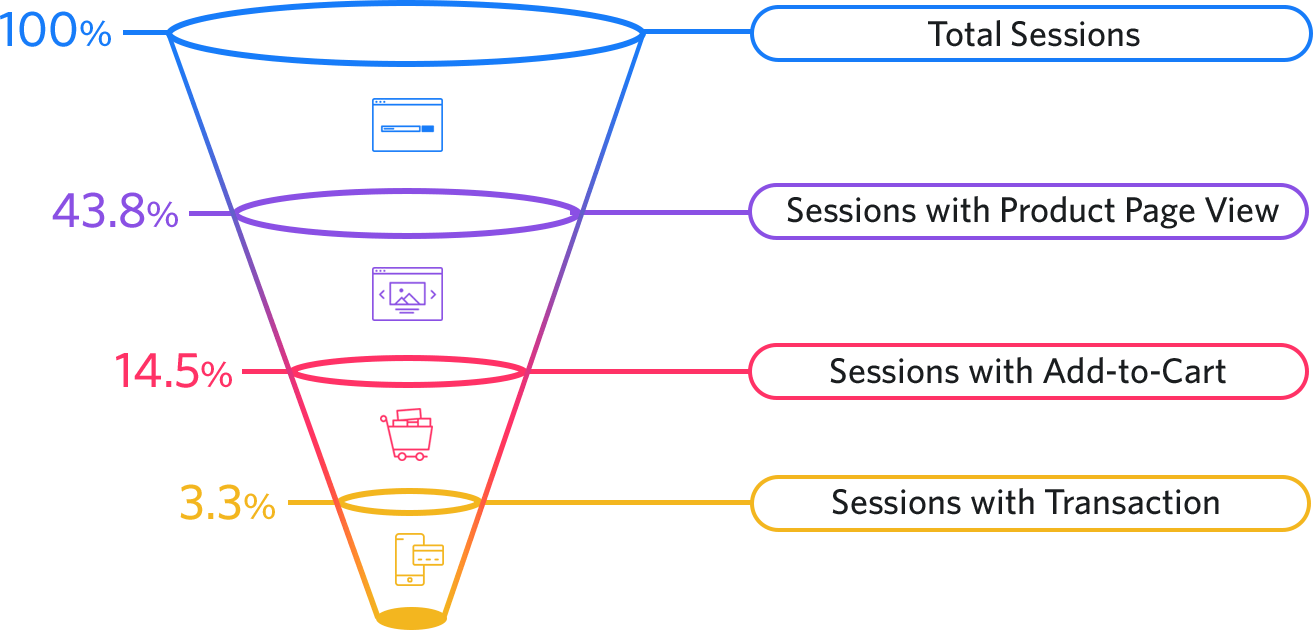
This funnel-based view of the conversion process is useful since as well as the average basket and sales conversion rates, it also shows the conversion rates to product page views which isn't published so often:
As would be expected, the number of sessions with product page views is much higher than the other micro-conversions, approaching 50 percent. This provides a useful benchmark and prompts retailers that it's useful to assess conversion to product page views when making site design improvements.
It also reminds us of the value of following up on interest in specific products and categories via sending personalized browse abandon emails which is the focus of the source of this post discussing best practices for browse abandons.
Retail conversion rates by device
The Monetate Ecommerce Quarterly is a great source giving regularly updated benchmarks on conversion segmented by devices and media for large Ecommerce brands.
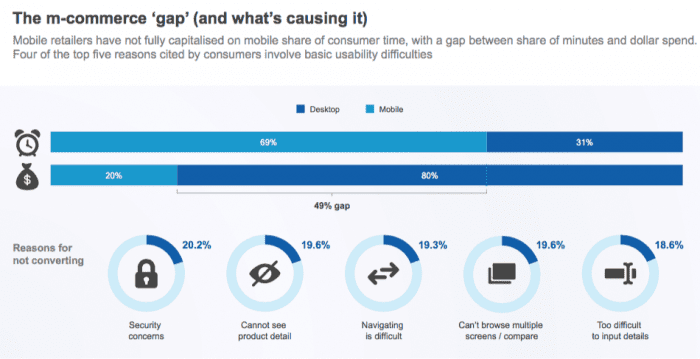
With shoppers increasingly using smartphone and tablet to purchase, it's vital for online retailers to know conversion benchmarks they should be achieving on smartphone device. You can see that typically m-commerce conversion rates are around half of those on desktop. Improvements in mobile experiences over the past years haven't impacted this figure, showing that smartphone is more popular as a device for browsing products while desktop is preferred more for transacting
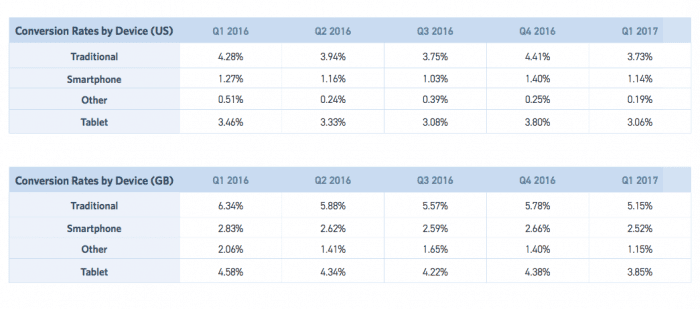
What are the reasons consumers are less likely to buy on smartphone?
The comScore Mobile Hierarchy report has some useful insight on this which retailers can use to improve their service or messaging to reassure consumers.
 December 2017 - Mobile conversion rates by traffic source or referrer
It's rare to see conversion comparisons by traffic source. This data is from an analysis of over $1 billion in sales on the Shopify platform over Black Friday / Cyber Monday when 64% of sales were on smartphone, a 10% increase from the previous year.
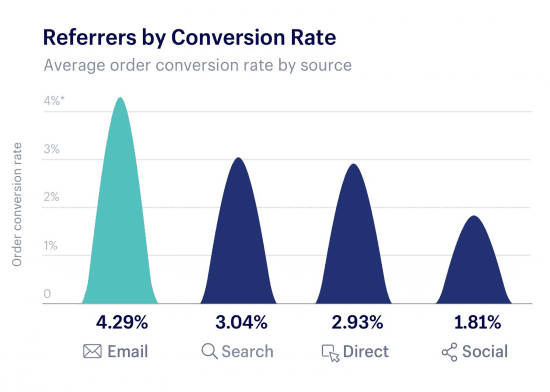
You can see that email is the highest converting channel. We would expect this since email subscriber lists contain customers (and some prospects) that have a higher conversion. Bear in mind that conversion rates for sales events can be significantly higher than during normal trading. Search visits are significantly higher converting than social since search has higher intent if someone is looking for a specific product or brand. Social media conversion has lower intent. Also since > 80% of social media browsing is on smartphone this will also decrease conversion since we have seen smartphone conversion is lower than desktop.
Mobile retail conversion rates
This report from the Adobe Digital Index retail report has a simple table comparing cart and visit (overall) conversion on smartphone vs tablet vs desktop. It shows that visit conversion is nearly 3 times higher on desktop vs smartphone.
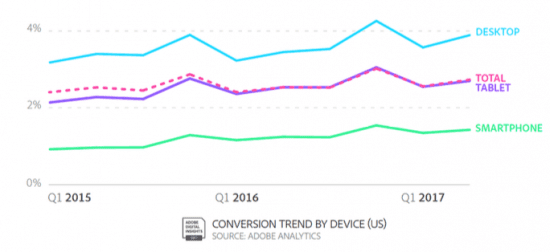 Here are the tablulated figures:
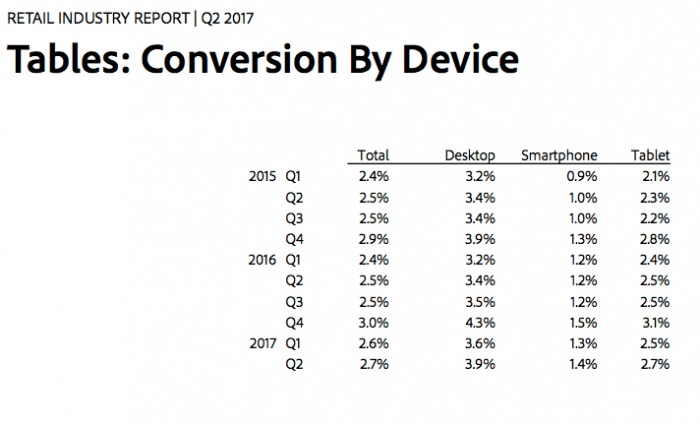
- Location: US Retail
- Date: Published Autumn 2017 (2016 data)
- Sample: Top 250 US retailers (so representative of common consumer behaviour)
- Source: Adobe Retail Industry report
If you're creating a business case for mobile-optimized sites as explained in our Ecommerce mobile and desktop wireframes guide or mobile marketing strategy guide, this data is also valuable since it shows the variation in conversion rate by mobile devices type. Tablet conversion rates are similar, but slightly lower than desktop conversion rates, suggesting people are increasingly comfortable with the experience of buying on tablets.
However, it's a different story for Smartphones since these convert at one-third to one-quarter of the rate of traditional or tablet devices.
This suggests smartphones are more of browse or research platform rather than a buy platform since many of the large retailers featured in this survey will have mobile-optimized sites. Smartphone experiences should be personalized to show this different form of usage. The lower conversion rates for mobile devices are also shown in these compilations of Android vs MacOS vs iOS operating systems, which gives the latest 4th quarter data released in early 2017.
Conversion rates by channel
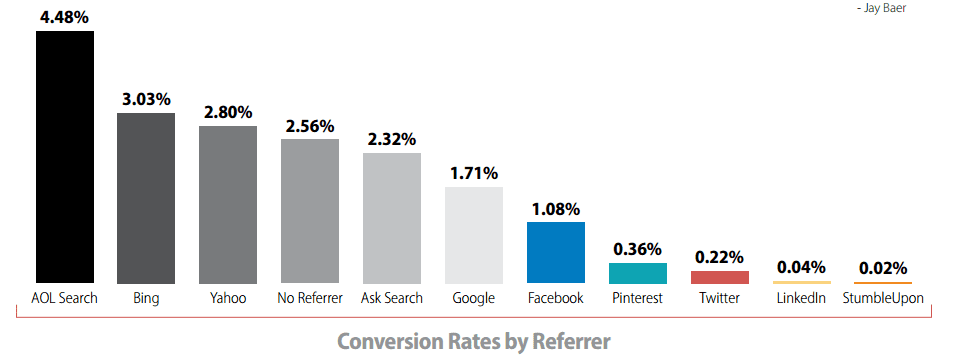
Conversion rates for other sectors: telecoms and travel
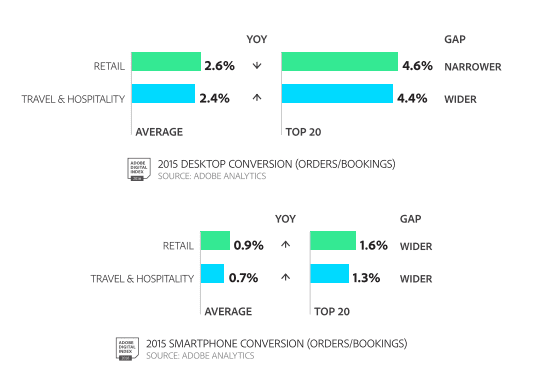
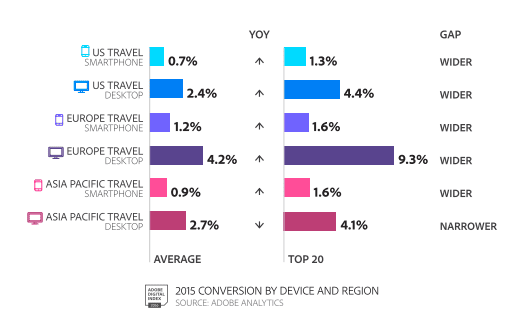
These are available in the Adobe Digital Index (ADI) - this data is available in the April 2016 published data for the whole of 2015.
Conversion rates for US vs Europe vs Asia Pacific for the travel industry
The ADI report also compares conversion for EMEA countries against the US. UK and US conversion are significantly lower than other European countries perhaps because of less competition or Amazon being lower in these countries. Different rates of smartphone adoption will also affect this cross-platform average.
Options for segmenting conversion rate
As Dan Barker suggests in his advice we mentioned at the start of this post, conversion rate gets more useful as you break it down by different types of visitors with different intent and a different relationship with the retailer. Different conversion rates and average order values can then be segmented for different audiences to understand and work to improve the quality of traffic or strength of propositions, for example:
- First time, repeat visitor or registered customer conversion
- Referring channel conversion, e.g. paid or natural search, social media, affiliates, display advertising
- Search type, e.g. paid or natural, brand, generic or long-tail
- Product category type - conversion rates are much higher for simple commodity products for example - flower purchase (double-digit percentage) compared with a higher cost product that will often be purchased in store (for example beds or furniture which will often be less than one percent).
- Promotion type or seasonal sale - the IMRG data and Coremetrics data below shows that conversion rate can increase dramatically at these times.
Conversion rates for non Ecommerce sites including B2B conversion
I'm also often asked about conversion rates in other sectors, particularly for business-to-business lead generation. While similar caveats about sub-category, type of visitor and strength of brand apply, this is a useful compilation from this older Marketing Sherpa of average conversion rates by industry sector.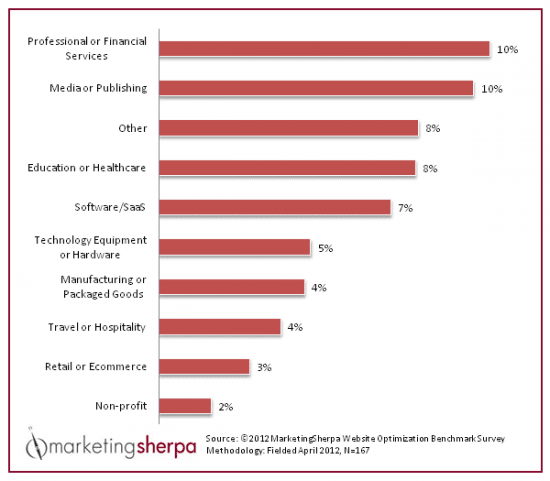

Lead generation and landing page conversion rates by sector
However, this gives 'self-reported' conversion rates for lead generation, so it was good to see this new Landing page lead generation conversion rate research from Unbounce giving lead conversion rates by industry particularly since it's based on real-data of conversion rather than reported data which is more common for B2B and other sectors. Industries covered include business-to-business, Travel, Healthcare, Legal and Education sectors.
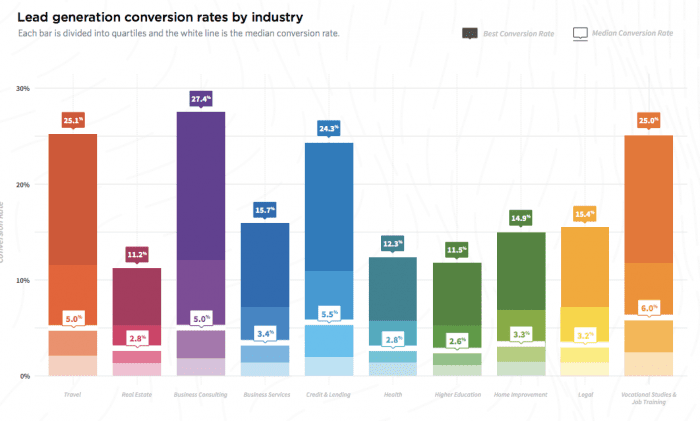 The chart shows wide variation within and between sectors with some businesses achieving lead generation conversion rates much higher than the media. So, to compare against your rates it's best to look at the media rates which vary between 2.8% and 6%.
Ecommerce Conversion Rate Benchmark
Despite popular opinion, traffic is not the most important metric in ecommerce.
Seeing your traffic spike might feel great, but unless those visitors turn into shoppers, you’re not growing your store. To grow your store effectively you need to focus on driving revenue and profit; and one metric that strongly correlates with both is Conversion Rate.
Your Conversion Rate describes how effectively your store is transforming visitors into shoppers. If, on average, 1 out of every 100 visitors performs a checkout, your Conversion Rate is 1%.
Increasing your Conversion Rate will improve the results of all your marketing efforts, making it easier for you to scale. So before investing money into Facebook, AdWords, or influencer campaigns, you should explore if there are any low-hanging fruits to improve Conversion Rate.
The first step is to ensure you have accurate tracking in place measuring how Conversion Rate changes over time. Doing so enables you to understand whether changes like a new design, payment function, or additional social proof are moving the needle in the right direction.
Tracking metrics historically is a good start because it gives you a sense if you’re moving in the right direction. And yet, whilst great for tracking your own store’s improvement, you won’t know objectively how good your Conversion Rate is.
Compass enables online stores to compare their metrics against similar stores in terms of product, revenue, and technology. This peer benchmarking allows you to learn about your individual strengths and weaknesses.
To help you understand how competitive your store is, we’re providing Conversion Rate industry benchmarks. These statistics help you understand if – and where – you need to focus your attention to increase Conversion Rate.
What is a good Conversion Rate in Ecommerce?
We’ve analyzed the 2017 performance of more than 10,000 online stores that use our ecommerce analytics app Compass to create the 2018 Ecommerce Conversion Rate Benchmark.
There are many factors that influence Conversion Rate such as product type, price, acquisition channel, and store appearance. To help you better understand what sort of Conversion Rate is the average within your niche, we’ve broken the benchmark down into different dimensions that provide you with actionable insights.
Before comparing this data to your own performance, make sure your Conversion Rate tracking works properly.
As a general rule, you should aim for at least average results in your category. However, you only get there and beyond by systematically improving on today’s efforts and successes.
We’re going to kick this off with a Conversion Rate benchmark by Acquisition Channel. Below you can see the median and top 25% Conversion Rate of more than 10,000 online stores that use Compass.
We’re going to kick this off with a Conversion Rate benchmark by Acquisition Channel. Below you can see the median and top 25% Conversion Rate of more than 10,000 online stores that use Compass.

Takeaways:
- With 5.44% median Conversion Rate, Referral is overall the best performing acquisition channel. Referral traffic is driven from external sites that link to your store. This can be an expert post recommending one of your products or a comment on a blogpost. If the traffic source is highly relevant, people often come with a strong purchase intent. This is why the average Referral Conversion Rate performs so well.
- With 5.32% median Conversion Rate, Email is the second best performing acquisition channel. Email traffic typically comes from existing customers that already know and trust you. The great thing about email marketing is that once you’ve built a decent email list you can quickly generate email traffic with personalized offers at very low cost.
- With 2.08% median Conversion Rate, Organic is the third best performing acquisition channel. Ranking well on search engines to receive significant organic traffic requires significant time and effort. Due to the need for frequent, optimized content and a long wait time before seeing results, it isn’t typically affordable for small stores. However, once you have reached a good standing on search engines you can rely on cheap, high quality traffic that tends to be quite sustainable.
With Compass you can track & benchmark your Conversion Rates in one central dashboard. Click here, to create a free Compass account.
Of course, ecommerce comprises a plethora of industries and product types; all of which convert at different rates. To help you better understand where you stand in the grand scheme of your industry, we’ve further broken down the Conversion Rate by popular product types:

Takeaways:
- With the median ranging between 0.68% and 3.58%, it’s clear that product type has a notable impact on Conversion Rates.
- With a median Conversion Rate of 3.58%, Food & Drink is the product segment with the highest Conversion Rate overall. While the median Conversion Rate is very close to Health & Beauty (3.08%), the top 25% Conversion Rate of Food & Drink is much higher (7.24% vs. 5.24%). However, remember that food is a necessity. Everyone has to eat so the stores that offer a great service grow a loyal customer base that regularly shops with them.
- With a median Conversion Rate of 0.74%, Furniture stores have the lowest overall Conversion Rate, which is not surprising. While Furniture is a huge industry, it’s very difficult for shoppers to buy expensive furniture online without seeing it in the real world. However, this could change with tech advancements bringing in features including Augmented Reality ecommerce experiences.
To dig further into the effects of product types and acquisition channels on Conversion Rate, we’ve created a table that compares Conversion Rate by product type andacquisition channel.

Takeaways
- The medians of Conversion Rates range between 0.20% and 11.11%. That’s a huge spread which shows both acquisition channel and product type have a remarkable impact on Conversion Rate. While 1% might be a good Conversion Rate for Social, it would be a terrible result for Email. It’s important to evaluate your Conversion Rates in an individual context.
- Email is the highest converting channel for almost every product type, however, within certain industries, it has an even larger impact. The Food & Drink and Health & Beauty industries see a disproportionately large increase in email traffic.
- Facebook is an often favored channel in modern ecommerce. However, it performs best for very visual products such as those in the Fashion, Electronics, Food & Drink and Beauty & Wellness niches.
The above benchmarks are great to get a general understanding of where your store ranks in terms of conversion per acquisition channel.
However, there are more important factors than acquisition channel that could impact your Conversion Rate. At Compass, our algorithm creates an individual group of the stores most similar to yours among our more than 10,000 users.
By comparing your Conversion Rate against these close competitors, you get more accurate results.
To get your free custom Conversion Rate Benchmark report, simply create a free Compass account and connect your Google Analytics & Ecommerce Platform. It’s 100% free and takes less than a minute!
Benchmark Conversion Rate for Turning Visitors iDepending on the kind of marketer you are, the question, "How effective are my marketing efforts?" can come in many forms. If you're a "quant" (i.e., natural quantitative thinker), you’re probably interested in the numbers (and probably lots of them, given how granular digital analytics can be). If you're more on the creative side, you're likely interested in perceived impact: What does your target audience feel or think during marketing campaigns? Do they respond the right way? Are they convinced of your message? You might find survey or focus group information the most useful available.
Regardless of your personality or skill set, when it comes to understanding marketing’s objective effectiveness within your company, the best measure is both quantitative and qualitative – and it’s called “a conversion.”
Deciphering What a Conversion Means
In my experience, the term “conversion” is used in a variety of ways, many of which are substandard or misleading. Contrary to popular thought there’s no standard set of marketing conversions, nor are benchmark conversion rates universal. Instead, the quality and measure of conversions depends on the company, its goals for growth, and its sales team’s effectiveness.
The whole point of examining conversions in marketing is to understand your marketing pipeline in terms of prospects’ varying states of sales-readiness. A conversion is a change in your relationship to prospects, beginning with your very first encounter. How you measure conversions depends on the marketing tactics you employ, the approach taken by Sales, and the level of consideration a typical prospect goes through when buying your product or service.
Setting Your Conversion Standards by the Buyer’s Journey
The best way of determining the right conversion rates to measure is by charting out the typical buyer’s journey. For manufacturing companies we often recommend the following steps in a buyer’s lifecycle:
- A website visitor becomes a contact by filling out an online form.
Conversion: Traffic-to-Inquiry or Traffic-to-Contact - The percentage of contacts that gave honest, intelligible information, demonstrating their willingness to have some level of relationship with you—i.e. leads.
Conversion: Inquiry/Contact-to-Lead - The percentage of leads that demographically fit criteria that would qualify to be a good fit for your company to work with: the right kind of company role, industry, and buying position in their organization.
Conversion: Lead-to-MQL (marketing-qualified lead) - The percentage of MQLs that cross the requisite threshold of desired interest and readiness to make a purchase, becoming a sales-qualified lead (SQL).
Conversion: MQL-to-SQL
Of course, depending on what you sell, you might not distinguish between MQLs and SQLs. Or perhaps your sales team is so focused on outbound calling that they don’t care to limit their activity to just SQLs.
Similarly, for most niche industries, such as specialty equipment manufacturing or industrial supply chain, there’s very little reason to filter out online inquiries from leads because website traffic is such that your visitors are likely highly qualified from the get-go.
How Should You Benchmark Conversion Rates?
If you search for help setting realistic but goal-oriented benchmarks, more likely than not most of the answers are going to come from marketing automation software companies like HubSpot, Eloqua, or Marketo. These kinds of companies talk a lot about lead generation conversion rates because that's why marketers like us buy the software in the first place.
If you’re looking for a realistic number, we recommend setting your top goal for visitor-to-contact conversion at 2%, but benchmarking somewhere along the lines of 1.6%. In analyzing Weidert Group’s high performing clients, we found that the initial visitor-to-contact conversion rate fell between the 1.0-1.5% range when companies were successfully attracting high quality leads, with a higher likelihood of qualifying as MQLs.
While marketing automation platforms need to promote their lead generation potential, their numbers often cause bloated expectations, especially in understanding conversion rates. If you really understand the their buyer's journey and your marketing pipeline, focus on benchmarking against robust but realistic conversion rates to measure the effectiveness of your marketing efforts.

Thanks a lot for sharing this amazing knowledge with us. This site is fantastic. I always find great knowledge from it. Drive store visits
ReplyDeleteAlmond flour uk A very awesome blog post. We are really grateful for your blog post. You will find a lot of approaches after visiting your post.
ReplyDeleteI just want to let you know that I just check out your site and I find it very interesting and informative.. Nangs Delivery Melbourne
ReplyDeletePositive site, where did u come up with the information on this posting?I have read a few of the articles on your website now, and I really like your style. Thanks a million and please keep up the effective work. Cream whippers
ReplyDelete